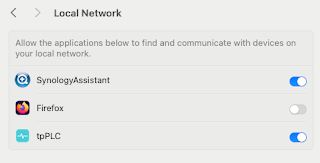
This is definitely something that's relevant to my project right here, right now
Thanks to developerWorks for the tip ….
Geeking in technology since 1985, with IBM Development, focused upon Docker and Kubernetes on the IBM Z LinuxONE platform In the words of Dr Cathy Ryan, "If you don't write it down, it never happened". To paraphrase one of my clients, "Every day is a school day". I do, I learn, I share. The postings on this site are my own and don’t necessarily represent IBM’s positions, strategies or opinions. Remember, YMMV https://infosec.exchange/@davehay
Whilst trying to hit my NAS from Firefox on my Mac, I kept seeing errors such as:- Unable to connect Firefox can’t establish a connection t...

2 comments:
Hello Dave,
I have always found that using the perfservlet is much faster and uses less resources than using wsadmin. It comes back as XML and you can parse it and the servlet is really fast.
Just some thoughts.
Hi Michael, thanks for this - will check out perfservlet, regards, Dave
Post a Comment